在excel中画图表,可以添加趋势线。
趋势线可以选择指数、线性、对数、多项式、乘幂、移动平均等几种。
以上各种趋势线都可以显示趋势线的公式,如下图所示为一个多项式趋势线的公式:
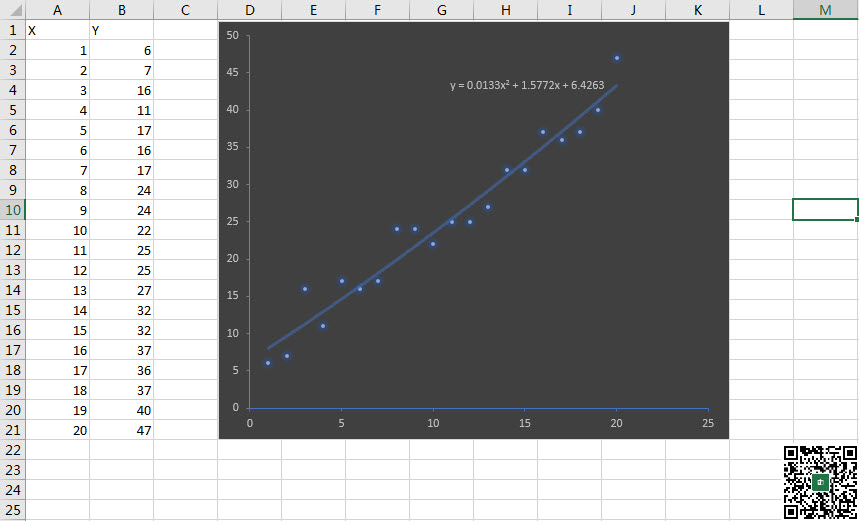
y = 0.0133x2 + 1.5772x + 6.4263
在vba中,如果要显示趋势线,首先要用Series对象的Trendlines集合对象的Add方法添加一个新的趋势线,然后要提取趋势线的公式文本,需要先显示趋势线的公式,用Trendline对象的DisplayEquation属性设置显示趋势线公式,然后获取趋势线的DataLabel对象,选中该对象,后用Text属性获取趋势线的公式文本。
其中趋势线集合对象Trendlines集合对象的Add方法的语法如下:
expression.Add (Type, Order, Period, Forward, Backward, Intercept, DisplayEquation, DisplayRSquared, Name)
这里要注意的是,其中的参数必须跟趋势线的类型想匹配,比如如果趋势线的类型是多项式,那么Order参数可以指定,但是如果趋势线的类型是线性的,那么Order参数是不能指定的。
如果要用vba提取上述公式,并获取它对应的系数0.0133、 1.5772、6.4263,可以使用如下的vba代码:
Sub QQ1722187970()
    Dim oChart As Chart
    Dim oChartObject As ChartObject
    Dim oWK As Worksheet
    Dim oSeries As Series
    Dim oTrendLine As Trendline
    Dim oDataLabel As DataLabel
    For Each oWK In Excel.ThisWorkbook.Worksheets
        Set oChartObject = oWK.ChartObjects(1)
        With oChartObject
            Set oChart = .Chart
            With oChart
                For Each oSeries In .SeriesCollection
                    With oSeries
                       iCount = 6
                       Set oTrendLine = .Trendlines.Add(Type:=xlPolynomial, Order:=iCount, DisplayEquation:=True, Name:="TL1", DisplayRSquared:=False)
                       With oTrendLine
                            Set oDataLabel = .DataLabel
                            With oDataLabel
                                .Select
                                sFormula = .Text
                                Debug.Print sFormula
                            End With
                       End With
                    End With
                Next
            End With
        End With
    Next
End Sub


发表评论